When processing traffic on a 6500, we generally like to see everything done in hardware. The CPU(really two CPU’s, one for Routing and one for Switching) is usually not involved with the traffic forwarding decision, and only really comes into the picture for a select few types of traffic. Some of these include:
- Control traffic (STP,CDP,VTP,HSRP, and similar protocols)
- Routing Updates
- Traffic destined to the switch (SSH,Telnet, SNMP)
- ACL entries with ‘log’ on the end of a line
- Fragmentation
For a full list please see this page at Cisco.
Netdr Overview
Netdr is a debug tool included with the 6500 platform that allows you to capture traffic going to/from the route processor or switch processor. Unlike other debugs that come with huge warnings of terrible things that could happen if you run them, netdr is generally considered to be safe. You can run it on a switch that already has very high CPU without any additional negative impact. The goal here is to see what type(s) of traffic are hitting the CPU and causing it to be so high, and then ultimately track that traffic down and stop it. There are a number of really good articles written on Cisco’s site and other blogs on how to use netdr to troubleshoot high cpu. Start here, and then use some Googling to fill in the missing pieces. I don’t want to reinvent the wheel here so I’ll leave how to use the tool to some of the other sites out there.
Interpreting the results
What I really wanted to share was this tool I came across on Cisco’s site. Once you use netdr and get the output it can be somewhat overwhelming to look at as well as tedious to sort through all of the results and get a good idea of what traffic is an issue and what traffic is normally hitting the cpu. The typical output looks something like this:
—— dump of incoming inband packet ——-
interface Vl204, routine mistral_process_rx_packet_inlin, timestamp 15:41:28.768
dbus info: src_vlan 0xCC(204), src_indx 0x341(833), len 0x62(98)
bpdu 0, index_dir 0, flood 0, dont_lrn 0, dest_indx 0x380(896)
EE020400 00CC0400 03410000 62080000 00590418 0E000040 00000000 03800000
mistral hdr: req_token 0x0(0), src_index 0x341(833), rx_offset 0x76(118)
requeue 0, obl_pkt 0, vlan 0xCC(204)
destmac 00.14.F1.12.40.00, srcmac 00.14.F1.12.48.00, protocol 0800
protocol ip: version 0x04, hlen 0x05, tos 0xC0, totlen 80, identifier 6476
df 0, mf 0, fo 0, ttl 1, src 10.20.204.3, dst 10.20.204.2, proto 89
layer 3 data: 45C00050 194C0000 0159F31B 0A14CC03 0A14CC02 0205002C
0AFEFE02 000007D0 00000002 00000110 53B4CAAE 00072005
0A2C004F 0AFEFE04 0000FFFF 00000344 00000380 1800
You can scan the output and see that all the pieces of a typical frame and packet are in there, Things like src/dst MAC, src/dst IP, protocol, and some data in hex format that isn’t easily readable. If you need to repeat this for a large number of packets it gets very tedious. I found (stumbled upon) a great tool on Cisco’s site that makes this all much easier.
Netdr Parser
On the Cisco tools site there is a link to the NetDR Parser. When you first get to the page it gives you the option of pasting your output into the window, or uploading a file that contains netdr output. If you have a lot of netdr data to go through I’d recommend you redirect the output to something like a tftp server using ‘show netdr capture l3-data | redirect tftp://a.b.c.d/netdroutput.txt’. That way you don’t need to worry about logging your ssh session or copy/pasting.
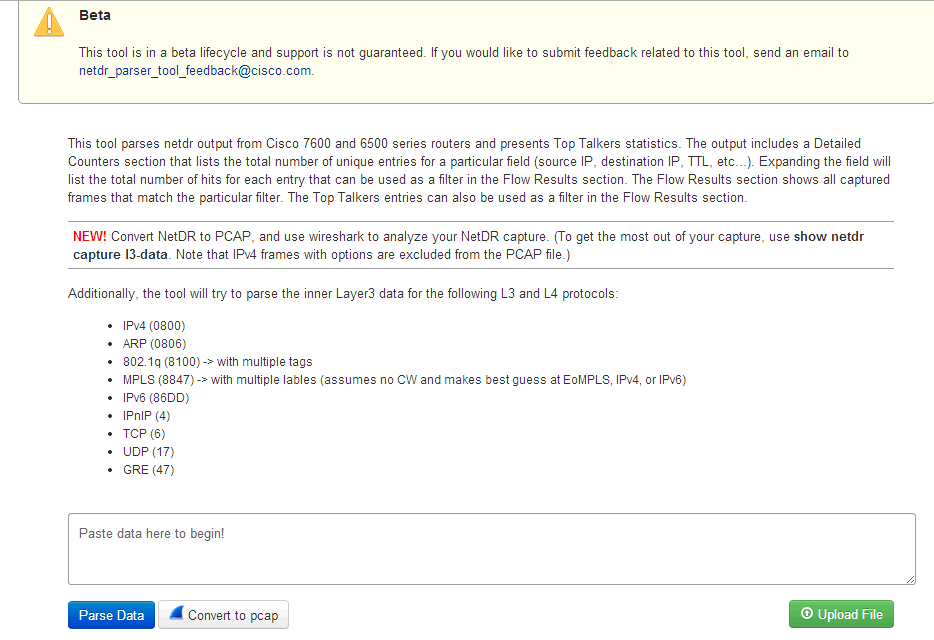
Once you get your NetDR output into the tool you click the ‘Parse Data’ button and the tool goes to work. The results page gives you a Top Talkers section similar to Netflow, with the top L2 and L3 talkers. It also has a detailed table where you can expand any of the rows by clicking on them.
This sample above was based on some netdr output I found on another site, it only contains two packets. If you want to see this in an even more familiar format you can click the ‘Convert to PCap’ button which will export a .pcap file for you to open in wireshark for further review.
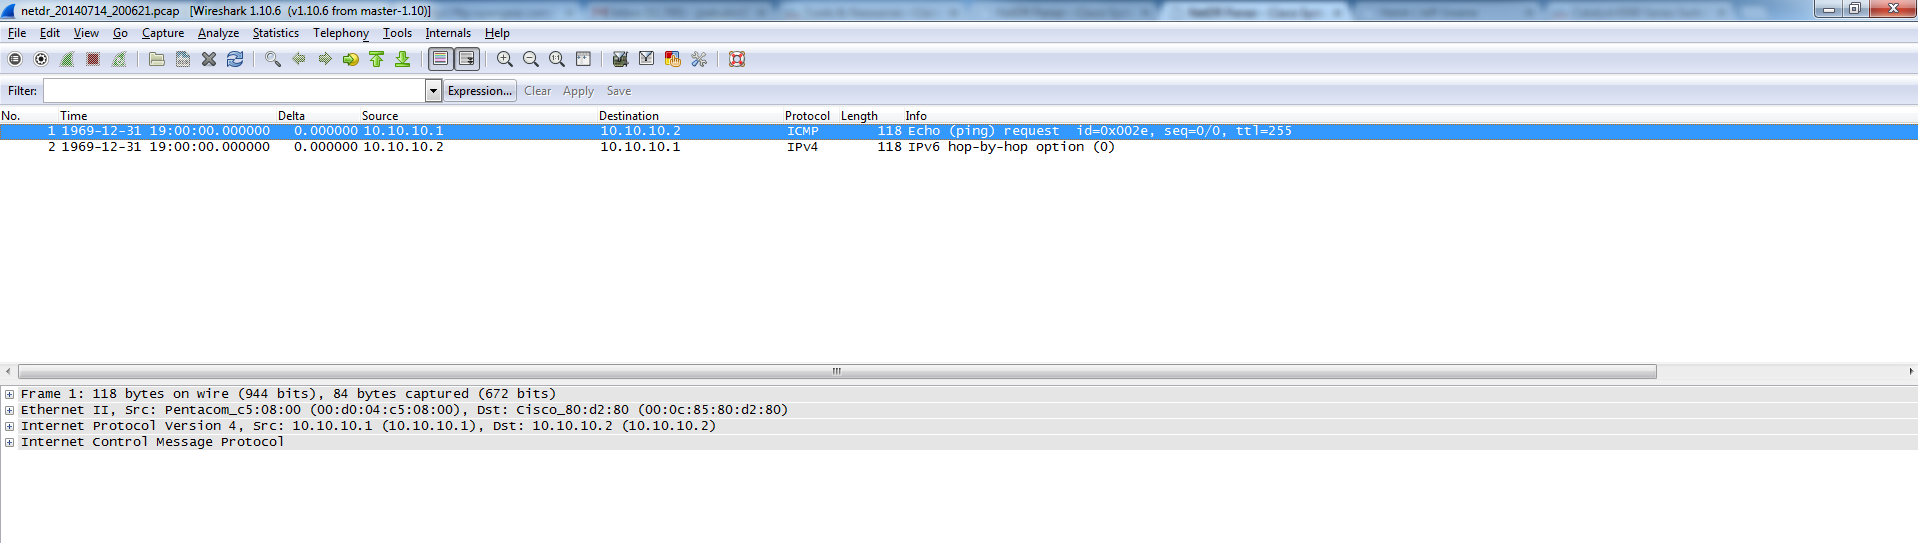 Now you can use any of the standard tools built into Wireshark to analyze the captured data. I think its great Cisco came up with this tool to help parse the netdr output. Gives the customer more power to initially troubleshoot without needing to jump immediately to TAC for support.
