Calculate throughput on the ASA

While scoping out new ASA’s for a project it dawned on me that I really had no idea on where the throughput statistics that are quoted on all the marketing material Cisco has come from.  You can see some of the throughput stats located on datasheets like this one: http://www.cisco.com/c/en/us/products/security/asa-firepower-services/models-comparison.html.  I was unable to find anything online that showed how exactly one would calculate these stats so I ended up opening a TAC case.  Here’s what TAC had to say:

Calculating Throughput

Unfortunately there is no single spot to go to see the current throughput of the ASA.  You can access the stats through the use of some math and the CLI.  It would be best to run this during a time where you expect your average amount of traffic to be going through the firewall, or run it when you think you will see a peak in traffic so you have a maximum throughput value to go off of.

  1.  Login to the ASA via the CLI and run the ‘clear traffic’ and ‘clear interface’ commands to zero out the statistics.  This won’t impact any traffic.
  2. Wait about 5 minutes for ASA to gather statistics on traffic traversing the firewall
  3. Run the ‘show traffic’ command
  4. Go to the section “Aggregated Traffic on Physical Interface”
  5. In that section gather the received bytes/sec and transmitted bytes/sec on all the physical interfaces (management included,  internal data interfaces not included)
  6. Then add all the data gather received and transmitted
  7. Since the result is in bytes/sec, multiply the result by 8 to get it on bits/sec
  8. Divide the result by 1024 to get it on kbps
  9. Finally divide again the result by 1024 to get it on Mbps

Here’s an example of the output from the ‘Aggregated Traffic’ section of my ‘show traffic’ command, highlighting in bold the values you need to add up in step 5 and 6 above.

—————————————-

Aggregated Traffic on Physical Interface
----------------------------------------
GigabitEthernet0/0:
        received (in 313.200 secs):
                3974936 packets 4421004800 bytes
                12691 pkts/sec  14115596 bytes/sec
        transmitted (in 313.200 secs):
                2504824 packets 652176414 bytes
                7997 pkts/sec   2082300 bytes/sec
      1 minute input rate 11450 pkts/sec,  12411522 bytes/sec
      1 minute output rate 7341 pkts/sec,  1936331 bytes/sec
      1 minute drop rate, 0 pkts/sec
      5 minute input rate 3248 pkts/sec,  3543329 bytes/sec
      5 minute output rate 2104 pkts/sec,  558594 bytes/sec
      5 minute drop rate, 0 pkts/sec
GigabitEthernet0/1:
        received (in 313.440 secs):
                2484960 packets 646085090 bytes
                7928 pkts/sec   2061271 bytes/sec
        transmitted (in 313.440 secs):
                4405564 packets 4352007757 bytes
                14055 pkts/sec  13884659 bytes/sec
      1 minute input rate 7451 pkts/sec,  1932038 bytes/sec
      1 minute output rate 13124 pkts/sec,  12648429 bytes/sec
      1 minute drop rate, 0 pkts/sec
      5 minute input rate 2113 pkts/sec,  555686 bytes/sec
      5 minute output rate 3687 pkts/sec,  3593754 bytes/sec
      5 minute drop rate, 0 pkts/sec
GigabitEthernet0/2:
        received (in 313.440 secs):
                10315 packets   4225880 bytes
                32 pkts/sec     13482 bytes/sec
        transmitted (in 313.440 secs):
                10961 packets   4229214 bytes
                34 pkts/sec     13492 bytes/sec
      1 minute input rate 26 pkts/sec,  10650 bytes/sec
      1 minute output rate 29 pkts/sec,  9610 bytes/sec
      1 minute drop rate, 0 pkts/sec
      5 minute input rate 8 pkts/sec,  3196 bytes/sec
      5 minute output rate 8 pkts/sec,  3342 bytes/sec
      5 minute drop rate, 0 pkts/sec
GigabitEthernet0/3:
        received (in 314.840 secs):
                87198 packets   11346440 bytes
                276 pkts/sec    36038 bytes/sec
        transmitted (in 314.840 secs):
                152634 packets  191774213 bytes
                484 pkts/sec    609116 bytes/sec
      1 minute input rate 111 pkts/sec,  19918 bytes/sec
      1 minute output rate 158 pkts/sec,  152740 bytes/sec
      1 minute drop rate, 0 pkts/sec
      5 minute input rate 40 pkts/sec,  10201 bytes/sec
      5 minute output rate 56 pkts/sec,  56747 bytes/sec
      5 minute drop rate, 0 pkts/sec
Internal-Control0/0:
        received (in 315.070 secs):
                728 packets     115926 bytes
                2 pkts/sec      367 bytes/sec
        transmitted (in 315.070 secs):
                871 packets     63736 bytes
                2 pkts/sec      202 bytes/sec
      1 minute input rate 2 pkts/sec,  366 bytes/sec
      1 minute output rate 2 pkts/sec,  201 bytes/sec
      1 minute drop rate, 0 pkts/sec
      5 minute input rate 0 pkts/sec,  102 bytes/sec
      5 minute output rate 0 pkts/sec,  56 bytes/sec
      5 minute drop rate, 0 pkts/sec
Internal-Data0/0:
        received (in 315.320 secs):
                6541313 packets 5424615442 bytes
                20744 pkts/sec  17203524 bytes/sec
        transmitted (in 315.320 secs):
                6541381 packets 5424661914 bytes
                20745 pkts/sec  17203672 bytes/sec
      1 minute input rate 18798 pkts/sec,  15250485 bytes/sec
      1 minute output rate 18798 pkts/sec,  15250444 bytes/sec
      1 minute drop rate, 0 pkts/sec
      5 minute input rate 5358 pkts/sec,  4362296 bytes/sec
      5 minute output rate 5358 pkts/sec,  4362296 bytes/sec
      5 minute drop rate, 0 pkts/sec
Management0/0:
        received (in 315.530 secs):
                501 packets     67986 bytes
                1 pkts/sec      215 bytes/sec
        transmitted (in 315.530 secs):
                51582 packets   69296696 bytes
                163 pkts/sec    219619 bytes/sec
      1 minute input rate 1 pkts/sec,  218 bytes/sec
      1 minute output rate 157 pkts/sec,  211434 bytes/sec
      1 minute drop rate, 0 pkts/sec
      5 minute input rate 0 pkts/sec,  60 bytes/sec
      5 minute output rate 45 pkts/sec,  61297 bytes/sec
      5 minute drop rate, 0 pkts/sec

If you add up all the bold values and run through the steps above you come out with about 252Mbps, which in this case is < the 650Mbps the ASA 5540 is rated for.

Advertisement

Deep dive into WCCP load balancing

Quick Overview

WCCP (Web Cache Communication Protocol) is a content routing protocol developed by Cisco that allows you to redirect traffic in real time.  A typical use case for WCCP would be if you have a proxy or load balancer that you want to redirect traffic to, all transparent to the end user(no configuration needed on browser).  Each WCCP setup has at least one WCCP client and one WCCP server where the proxy would be the client, and the Cisco switch/router would be the server. An access list on the switch/router defines which traffic should be redirected via WCCP, and which traffic should flow through as normal.  WCCP allows for easy scaling, fault tolerance, and load balancing.  The load balancing piece of WCCP gets a little involved so let’s take a look at how that works.

Masks and Buckets

In the case when you have more than one WCCP client, maybe you have two web proxies, WCCP provides built-in load balancing.  The way that WCCP determines which traffic is sent to each proxy is through the use of a Mask value that it applies to the IP addresses as they pass through the redirect on the switch or router.  Whether the mask gets applied to the source or destination IP is controlled by a setting on the WCCP client.  Where does the mask get set? It’s set on the WCCP client, for this example we’ll use a Websense proxy, which sets the default value to the hex value 0x1741.  The logical product of the mask and IP address, produces a value which will be called the bucket.  The buckets then get evenly distributed between WCCP clients, and your traffic is distributed accordingly.  Confused yet? Let’s break it down piece by piece.

Math

First let’s convert everything into binary. For this example, let’s use the source IP 192.168.100.5 and the default Websense mask of 0x1741.

Converting the IP to binary:      11000000 10101000 01100100 00000101

Converting the mask to binary: 00000000 00000000 00010111 01000001

Now let’s see how many possible buckets we can have with this mask. This is controlled purely by the number of ‘1’s in the mask.  If you take 2^number of 1 bits in mask, you will get the number of buckets available, in this case the mask has 6 bits set, so 2^6 = 64 buckets.  There are 64 possible combinations you could come up with when you logically AND any IP address with this specific mask

Let’s perform a sample logical AND.

logicaland

Logical AND means that any any place there is a ‘1’ in both columns of the source IP and mask, it will generate a ‘1’ in the result.  Any other combination(0 and 1, 0 and 0, 1 and 0, all equal 0).

logicalandtable

So the final result(Bucket) is 00000000 00000000 00000100 00000001, or 0x401 in hex. If you took different source IP addresses and went through the math to logically AND them together you would end up with different resulting buckets, but only 64 buckets total(2^6).  Here is the output from a Cisco switch that was connected via WCCP to two proxies(10.20.30.40 and 10.20.30.50) using the default mask 0x1741. You can see that it split up the 64 buckets into two groups (buckets 0 – 31 assigned to WCCP client ID 10.20.30.50) and (buckets 32 – 64 assigned to WCCP client ID 10.20.30.40). I added a couple comments in bold and highlighted the row where the resulting value was 0x401, from our example.

switch#show ip wccp 90 detail
WCCP Client information:
WCCP Client ID: 10.20.30.50
Protocol Version: 2.0
State: Usable
Redirection: L2
Packet Return: L2
Packets Redirected: 99
Connect Time: 1d19h
Assignment: MASK

Mask SrcAddr DstAddr SrcPort DstPort
—- ——- ——- ——- ——-
0000: 0x00001741 0x00000000 0x0000 0x0000 <——— This is our mask 0x1741, under the ‘SrcAddr’ column

Value SrcAddr DstAddr SrcPort DstPort CE-IP
—– ——- ——- ——- ——- —–
0000: 0x00000000 0x00000000 0x0000 0x0000 0x0A141E32 (10.20.30.50)
0001: 0x00000001 0x00000000 0x0000 0x0000 0x0A141E32 (10.20.30.50)
0002: 0x00000040 0x00000000 0x0000 0x0000 0x0A141E32 (10.20.30.50)
0003: 0x00000041 0x00000000 0x0000 0x0000 0x0A141E32 (10.20.30.50)
0004: 0x00000100 0x00000000 0x0000 0x0000 0x0A141E32 (10.20.30.50)
0005: 0x00000101 0x00000000 0x0000 0x0000 0x0A141E32 (10.20.30.50)
0006: 0x00000140 0x00000000 0x0000 0x0000 0x0A141E32 (10.20.30.50)
0007: 0x00000141 0x00000000 0x0000 0x0000 0x0A141E32 (10.20.30.50)
0008: 0x00000200 0x00000000 0x0000 0x0000 0x0A141E32 (10.20.30.50)
0009: 0x00000201 0x00000000 0x0000 0x0000 0x0A141E32 (10.20.30.50)
0010: 0x00000240 0x00000000 0x0000 0x0000 0x0A141E32 (10.20.30.50)
0011: 0x00000241 0x00000000 0x0000 0x0000 0x0A141E32 (10.20.30.50)
0012: 0x00000300 0x00000000 0x0000 0x0000 0x0A141E32 (10.20.30.50)
0013: 0x00000301 0x00000000 0x0000 0x0000 0x0A141E32 (10.20.30.50)
0014: 0x00000340 0x00000000 0x0000 0x0000 0x0A141E32 (10.20.30.50)
0015: 0x00000341 0x00000000 0x0000 0x0000 0x0A141E32 (10.20.30.50)
0016: 0x00000400 0x00000000 0x0000 0x0000 0x0A141E32 (10.20.30.50)
0017: 0x00000401 0x00000000 0x0000 0x0000 0x0A141E32 (10.20.30.50)
0018: 0x00000440 0x00000000 0x0000 0x0000 0x0A141E32 (10.20.30.50)
0019: 0x00000441 0x00000000 0x0000 0x0000 0x0A141E32 (10.20.30.50)
0020: 0x00000500 0x00000000 0x0000 0x0000 0x0A141E32 (10.20.30.50)
0021: 0x00000501 0x00000000 0x0000 0x0000 0x0A141E32 (10.20.30.50)
0022: 0x00000540 0x00000000 0x0000 0x0000 0x0A141E32 (10.20.30.50)
0023: 0x00000541 0x00000000 0x0000 0x0000 0x0A141E32 (10.20.30.50)
0024: 0x00000600 0x00000000 0x0000 0x0000 0x0A141E32 (10.20.30.50)
0025: 0x00000601 0x00000000 0x0000 0x0000 0x0A141E32 (10.20.30.50)
0026: 0x00000640 0x00000000 0x0000 0x0000 0x0A141E32 (10.20.30.50)
0027: 0x00000641 0x00000000 0x0000 0x0000 0x0A141E32 (10.20.30.50)
0028: 0x00000700 0x00000000 0x0000 0x0000 0x0A141E32 (10.20.30.50)
0029: 0x00000701 0x00000000 0x0000 0x0000 0x0A141E32 (10.20.30.50)
0030: 0x00000740 0x00000000 0x0000 0x0000 0x0A141E32 (10.20.30.50)
0031: 0x00000741 0x00000000 0x0000 0x0000 0x0A141E32 (10.20.30.50)

WCCP Client ID: 10.20.30.40
Protocol Version: 2.0
State: Usable
Redirection: L2
Packet Return: L2
Packets Redirected: 8
Connect Time: 1d19h
Assignment: MASK

Mask SrcAddr DstAddr SrcPort DstPort
—- ——- ——- ——- ——-
0000: 0x00001741 0x00000000 0x0000 0x0000

Value SrcAddr DstAddr SrcPort DstPort CE-IP
—– ——- ——- ——- ——- —–
0032: 0x00001000 0x00000000 0x0000 0x0000 0x0A141E28 (10.20.30.40)
0033: 0x00001001 0x00000000 0x0000 0x0000 0x0A141E28 (10.20.30.40)
0034: 0x00001040 0x00000000 0x0000 0x0000 0x0A141E28 (10.20.30.40)
0035: 0x00001041 0x00000000 0x0000 0x0000 0x0A141E28 (10.20.30.40)
0036: 0x00001100 0x00000000 0x0000 0x0000 0x0A141E28 (10.20.30.40)
0037: 0x00001101 0x00000000 0x0000 0x0000 0x0A141E28 (10.20.30.40)
0038: 0x00001140 0x00000000 0x0000 0x0000 0x0A141E28 (10.20.30.40)
0039: 0x00001141 0x00000000 0x0000 0x0000 0x0A141E28 (10.20.30.40)
0040: 0x00001200 0x00000000 0x0000 0x0000 0x0A141E28 (10.20.30.40)
0041: 0x00001201 0x00000000 0x0000 0x0000 0x0A141E28 (10.20.30.40)
0042: 0x00001240 0x00000000 0x0000 0x0000 0x0A141E28 (10.20.30.40)
0043: 0x00001241 0x00000000 0x0000 0x0000 0x0A141E28 (10.20.30.40)
0044: 0x00001300 0x00000000 0x0000 0x0000 0x0A141E28 (10.20.30.40)
0045: 0x00001301 0x00000000 0x0000 0x0000 0x0A141E28 (10.20.30.40)
0046: 0x00001340 0x00000000 0x0000 0x0000 0x0A141E28 (10.20.30.40)
0047: 0x00001341 0x00000000 0x0000 0x0000 0x0A141E28 (10.20.30.40)
0048: 0x00001400 0x00000000 0x0000 0x0000 0x0A141E28 (10.20.30.40)
0049: 0x00001401 0x00000000 0x0000 0x0000 0x0A141E28 (10.20.30.40)
0050: 0x00001440 0x00000000 0x0000 0x0000 0x0A141E28 (10.20.30.40)
0051: 0x00001441 0x00000000 0x0000 0x0000 0x0A141E28 (10.20.30.40)
0052: 0x00001500 0x00000000 0x0000 0x0000 0x0A141E28 (10.20.30.40)
0053: 0x00001501 0x00000000 0x0000 0x0000 0x0A141E28 (10.20.30.40)
0054: 0x00001540 0x00000000 0x0000 0x0000 0x0A141E28 (10.20.30.40)
0055: 0x00001541 0x00000000 0x0000 0x0000 0x0A141E28 (10.20.30.40)
0056: 0x00001600 0x00000000 0x0000 0x0000 0x0A141E28 (10.20.30.40)
0057: 0x00001601 0x00000000 0x0000 0x0000 0x0A141E28 (10.20.30.40)
0058: 0x00001640 0x00000000 0x0000 0x0000 0x0A141E28 (10.20.30.40)
0059: 0x00001641 0x00000000 0x0000 0x0000 0x0A141E28 (10.20.30.40)
0060: 0x00001700 0x00000000 0x0000 0x0000 0x0A141E28 (10.20.30.40)
0061: 0x00001701 0x00000000 0x0000 0x0000 0x0A141E28 (10.20.30.40)
0062: 0x00001740 0x00000000 0x0000 0x0000 0x0A141E28 (10.20.30.40)
0063: 0x00001741 0x00000000 0x0000 0x0000 0x0A141E28 (10.20.30.40)

Choosing the best mask

So we go through all the math, see the number of buckets, how traffic would be distributed evenly but how can we use the mask value to our advantage when deploying WCCP?  First, with the default mask it allows for 64 buckets to be distributed between only two proxies. We don’t really need all of those different buckets if we only have two WCCP clients(proxies).  If we remember from above that the number of buckets is equal to 2^number_of_bits_in_mask, then at a minimum we need only one ‘1’ bit somewhere in the mask to generate two buckets, one bucket going to proxy A and one bucket going to proxy B.  This has an added benefit on the switch by using up less of the TCAM resources.  See this link, table 3 for more info.  How you choose the best mask really depends on the type of traffic in your environment, how many proxies/WCCP clients you have, and how you want to load balance it.  Cisco recommends not using the default of 0x1741. If you have multiple sites, each one having a /16 address space, you might want to create a mask that results in each /16 getting balanced through a different proxy. If you have a single site with a number of /24 subnets you probably want to look at the third or fourth octet of the IP address so the hash is more effective(since the first two octets will always be the same a hash taking effect on those octets will be less effective at balancing traffic).  Here are a couple of examples:

  • A mask of 0x0, we end up with one bucket(2^0=1), which means there could only be one proxy, and no load balancing would take place.
  • A mask of 0x1 (00000000 00000000 00000000 00000001), we end up with two buckets (2^1=2), with even numbered last octet IP addresses going to one proxy and odd numbered last octet IP addresses going through the other proxy.
  • A mask of 0x100 (00000000 0000000 00000001 00000000), we end up with two buckets again, with even third octets going to one proxy and odd numbered third octets going to a different proxy

Cisco has a good writeup on their recommendations on the WCCP mask values for different environments available on this page. Here is an excerpt from Cisco:

  • We do not recommend using the WAAS default mask (0x1741). For data center deployments, the goal is to load balance the branch sites into the data center rather than clients or hosts. The right mask minimizes data center WAE peering and hence scales storage. For example, use 0x100 to 0x7F00 for retail data centers that have /24 branch networks. For large enterprises with a /16 per business, use 0x10000 to 0x7F0000 to load balance the businesses into the enterprise data center. In the branch office, the goal is to balance the clients that obtain their IP addresses via DHCP. DHCP generally issues client IP addresses incrementing from the lowest IP address in the subnet. To best balance DHCP assigned IP addresses with mask, use 0x1 to 0x7F to only consider the lowest order bits of the client IP address to achieve the best distribution.

Choosing a mask that works best with your environment allows you to have better control of how traffic will be distributed between proxies and makes it much more deterministic so if for example you choose 0x1 as your mask you know that any clients with even last octets are going through one proxy and all the odd last octets are going through another proxy.  During troubleshooting if you get reports that users are having issues possibly related to the proxy, by knowing what their IP ends in you can quickly correlate if all the odd numbered IPs are having an issue but even numbered IPs aren’t that Proxy A may need to be looked further.

X-Forwarded-For, proxies, and IPS

When deploying an IPS appliance I saw a challenge that might come up if you are installing the IPS appliance in addition to a web proxy. One of the by-products of using the default settings of the proxy is that all user traffic going through the proxy ends up being NATted to the IP address of the proxy prior to going to the firewall.  Normally this wouldn’t cause a problem but when you want to setup the IPS appliance to look at all traffic between the inside and firewall it presents an issue.  We lose visibility into what the original client IP address is, all traffic appears as it is coming from one single IP address of the web proxy making IPS logs less useful. In an ideal situation you would be able to place the IPS in a position where it would examine the actual source IP address but not all networks may be able to accommodate this.  One workaround is to utilize the x-forwarded-for header option on your proxy.

X-Forwarded-For Header

There is an industry standard(but not RFC) header available for HTTP called x-forwarded-for, that identifies the originating IP address of an HTTP request, regardless of if it goes through a proxy or load balancer. This header would typically be added by the proxy or load-balancer, but it’s worth noting that there are plugins out there that let a web browser insert this field(whether it is real or spoofed).

Current State

Our current state and traffic flow looks something like this:

before

The IP starts as the original ‘real’ client IP, and as it goes through the proxy(websense in this case) it gets changed to the IP of websense.  As it goes through the firewall it then gets changed to the IP of the firewall prior to hitting the Internet. Here’s a screenshot of a HTTP GET in wireshark, without any header:

no xforward

Adding in the header

To add the header in Websense you can find the option here in the content gateway GUI:

x-forwarded-for

X-Forwarded State

After enabling the addition of x-forwarded-for headers in Websense this is what our traffic looks like:

After

Here’s a screenshot of an HTTP GET in Wireshark that includes the header, spoofed to 1.2.3.4:

xforward

Inspection

Once this header is added it allows some IPS appliances/software to inspect the x-forwarded-for header and report on the actual client IP address.  Snort currently supports this and there is more detail here. I believe that other IPS appliances such as Cisco’s Sourcefire also supports this option through enabling the HTTP inspect preprocessor and checking ‘Extract Original IP address’ option.  Will work on confirming this and updating the post sometime soon. If you want to look at this traffic in wireshark there is a display filter ‘http.x_forwarded_for’ that will let you filter on x-forwarded-for.

Risks

I’d like to point out that the x-forwarded-for header gets carried in the packet out into the Internet which may or may not concern some people as it releases more information about your internal IP addresses structure than you might have wanted.  I tried to see if there was an ASA feature to strip this header out but couldn’t find anything that looked like it fit besides this Cisco bug report/request for the feature. Also, as mentioned above you can spoof this header pretty easily, it is not authenticated or signed, and is presented in plain text.  Each deployment will be unique and you’ll have to weigh out the risks and whether this is a feature that is worth implementing for your specific environment.

So many pings…

When I got into networking there was only one type of ping I was familiar with: ping.  After being in networking for awhile and working with different groups I’ve come to encounter a few other varieties of ping-like tools that are used to perform basic troubleshooting for different applications.  Here’s a high level look at some of the more popular ones I have encountered.

Ping

Ping is probably the most common and well known tool for troubleshooting reachability of a host.  Ping usually uses ICMP (although it can be set to use UDP or TCP on operating system). It sends an echo packet to the destination and waits for the echo-reply packet to be sent back.  With it’s default settings ping is able to show you if a host is active, the round trip time, TTL, and any packet loss.  Using other options you can also use it to troubleshoot fragmentation issues, MTU issues, or determine the return path (record option).  Ping comes standard on every operating system as well as all networking hardware. For more info on the version of ping included in Cisco IOS check out this page.

TNSPing

TNSPing is a utility created by Oracle to determine if an Oracle service can be successfully reached over the network. It only confirms if the listener is up and will not give you any indication of the state of the database itself.

TNSPing will test a few things:

  • Was the service name specified correctly – typically it is defined in the tnsnames.ora file
  • Is the listener listening (if it can’t connect to the listener you can doublecheck the correct port was specified in the tnsnames.ora file and that any firewall between the tnsping utility and destination is allowing the traffic)
  • The roundtrip time for each connection test

For more information on TNSPing check out this link from Oracle.

NIPing

NiPing is a tool developed by SAP.  Niping will test:

  • to test network connectivity
  • latency
  • throughput.

Niping works similarly to a iperf/ttcp test in that it requires a client and server version of the tool to run.  Like TNSPing, Niping runs tests on a higher level than ICMP does.  Niping is useful to see if the required ports for SAP are open on a firewall if telnet isn’t available.  For more information on NiPing check out this link.

Split DNS with Cisco Routers

We recently deployed a remote office in China, where we were tunneling all traffic back to a central location to be filtered by a proxy.  It didn’t take long for complaints of slowness to start coming in, and understandably so.  At the time we had no way of filtering the traffic through a local proxy, but this later changed and we were able to take advantage of Websense in the cloud (look for a future article on this).  We ended up sending Internet traffic out locally from the site, filtered by a Websense agent and expected all of the complaints to disappear.  But they didn’t.  After looking into the issue one of our engineers found that we didn’t think about how DNS traffic would flow in this setup.  While Internet traffic itself was leaving the site locally, DNS traffic was still coming back to the US for resolution.  This presents two main problems:

  1. The DNS request/response had to come back to the US, which takes about 300 ms RTT. That’s 300 ms extra time added on to however long it takes to load your site.
  2. Since the DNS request was taking place in the US, any website that uses a service like Akamai or some other geographical load balancing was serving up the sites closest to the US.  So you wind up with Internet traffic leaving the office in China locally, and then still coming all the way back to the ‘best’ server closest to where the DNS resolution was done in the US.  Really no better then you were to start.

This presented a problem.  How do we perform DNS lookups for all of the Internet sites using some local Chinese ISP DNS, while still sending DNS requests for internal sites and websites to our own internal corporate servers.  A quick google turned up a Cisco feature called split DNS which did exactly this.


Split DNS

The concept behind split DNS is pretty straightforward.  Cisco allows you to setup multiple DNS views, each with a different DNS server, that directs traffic based on certain parameters that you pick.  To make this work you also end up changing your clients to point to the router interfaces themselves for DNS servers, and the router then forwards on the request to the appropriate DNS server depending on the criteria you set.  In our case we were using the Cisco router for DHCP as well, so we modified the Cisco DHCP scope to include the router itself as the DNS server.


The Config

ip dns server ! enable the DNS server on the Cisco router
ip dns view corporate-internal  ! Define a view called ‘corporate-internal’ which contains corporate DNS Server IP addresses
     dns forwarder <your_internal_DNS_server_IP>       
     dns forwarder <your_backup_internal_DNS_server_IP>
 
ip dns view default            ! Define a view called ‘default’ which contains non corporate, public DNS Server IP Addresses
dns forwarder 114.114.114.114 ! China public DNS servers, similar to Google’s 8.8.8.8
dns forwarder 114.114.114.119
 
ip dns view-list dnsview !This view-list assigns a priority to each of the DNS views from above, and also links the ‘corporate internal’ view servers to the name-group ‘1’ . Name-group 1 refers to the ip dns name-list 1 lines in the next section, similar to an ACL, but DNS
view corporate-internal 10 !bind the view called ‘corporate-internal’ to the group called name-group
     restrict name-group 1 ! The ‘1’ here refers to the DNS name-list in the section below
view default 99 
 
ip dns name-list 1 permit 10\IN-ADDR      !match reverse DNS records for the 10/8 net
ip dns name-list 1 permit .*.yourdomain.com      !match anything ending in your domain.com
 
ip dns server view-group dnsview    !Apply the DNS ‘view-list’ to the Cisco DNS Server
 

Once this config is in there, it works like this.  Anytime a DNS query from a client comes in to the router, it will look to see what site you are trying to go to.  If it matches the ‘name-list’ in our example, so say intranet.yourdomain.com, it will then know to use the ‘corporate-internal’ view and forward that DNS request to the appropriate internal servers.  If the domain name you are trying to reach does not match the name-list, for example google.com, then you will fall down to the DNS view called ‘default’ in the view-list, which will forward your DNS request to a different set of DNS servers.


Results

After making these changes we saw pretty impressive improvements.  We got rid of the 300+ ms RTT for the DNS request itself, and in addition we were now getting geographically appropriate results for the DNS queries which means that the servers returned to us were usually much closer, and therefore quicker.  There are a ton of other options and complexity you can add to this feature. If you are interested in learning more check out this Cisco page to get started.

Managing Packet Captures

Packet captures are an important part of the network engineers toolkit.  They provide a look into what is really going on in your network and help get to the bottom of troubleshooting an issue very quickly.  In addition to getting to the bottom of a problem, they also serve as a great learning tool to get a better understanding of how different protocols work, and more importantly how they work in your network.  A company called QA cafe has a really great product called Cloudshark, that allows you to manage and analyze your packet captures without installing any software like Wireshark locally. Everything is handled in the web browser.  I wanted to write a quick post to take a look at the available options from Cloudshark and how they might work best for you.

Overview

Cloudshark was intended to be used as a hardware or VM appliance within a company.  Employees could then upload packet captures to the appliance for storage and analysis.  They currently offer a Solo, Professional, and Enterprise version, with the biggest difference being the number of accounts you can create on each and an ability to integrate with Active Directory for the enterprise version.  I recently setup the enterprise VM appliance and it was extremely quick to get going, requiring barely any input from me.  If you aren’t sure if you want to commit to spending money on the product and want to try it out, or need to send someone a packet capture (that doesn’t contain sensitive information) for further review, they do have a page that allows you to upload up to 10MB of a capture, and then will generate a URL you can send off to someone else.  I encourage you to check it out here:https://appliance.cloudshark.org/upload/

Features

Cloudshark really worked to get as many features from Wireshark into the web based product, to the point that sometimes you forget that you are working in a web browser.  When you first login to the product you are presented with a page that has a list of your currently uploaded files, as well as a place to upload new files, or search for a saved capture. The interface is clean, and easy to find what you’re looking for.


Increase Cisco TFTP speed

I was recently copying a fairly large 400 MB IOS image to one of our ASR routers and it was taking forever via TFTP.  I had seen this before but never really took any time to look into it further. I always switched to FTP, the transfer went faster, and I never looked back.  This time I decided to go to Wireshark and take a deeper look. In this post I’ll show you why it’s slow and how to improve the speed, but perhaps more importantly, how to get to the bottom of something like this using Wireshark. 

Default TFTP Setting

I performed a packet capture on a TFTP session using the default Cisco router and TFTP server settings.  It immediately became clear what the issue was.  Here is a screenshot as well as a link to part of the capture file on Cloudshark.

tftpdefaultscreencap

The length of each of the frame is ~500 bytes.  This was being transferred over Ethernet, which has a max frame size of 1518 bytes.  This means we weren’t fully taking advantage of our available frame size.  It’d be the equivalent if I told you to empty a swimming pool and you had the option to use a small plastic cup or a 5 gallon bucket for each trip you took to the pool.  The 5 gallon bucket would require far less trips back and forth and decrease the total time needed to empty the pool.

According to the RFC for TFTP, TFTP will transfer data in blocks of 512 bytes at a time, which is what we were seeing with our default settings.

Make it faster

So how do we make this go faster? Well, besides using one of the other TCP based alternatives like SCP or FTP, there is an option in IOS available to increase the TFTP blocksize.  In my case I am using an ASR router and the option was there. I didn’t look into seeing which other platforms/ IOS versions this is supported in. 

The command you are interested in is: ip tftp blocksize <blocksize> In my case I chose to set the blocksize to 1200 bytes because I have the Cisco VPN client installed which changes your MTU size to 1300 bytes and I didn’t want to deal with fragmentation.  Here’s a screenshot of the transfer with the updated block size and link to capture on Cloudshark.org.

tftpincreasedblocksize

Confirming the increase

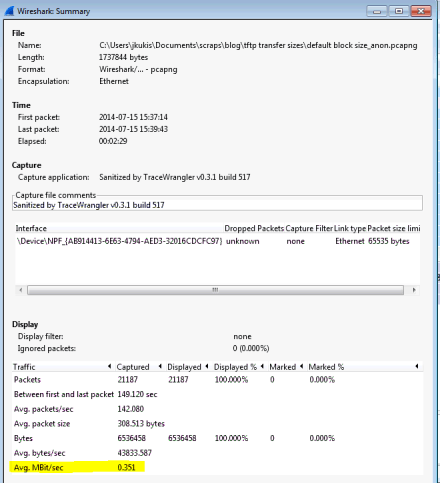
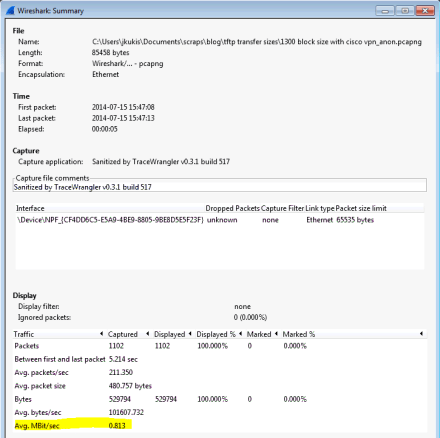
Besides seeing the bigger blocksize in the capture and noticing the speed was faster, let’s back it up with some real data.  If you click the Statistics – Summary menu you can see an average rate for each capture.

Here’s the ‘before’ rate with the default block size:

defaultblocksizesummary

And here is the summary using the increased block size of 1200 bytes:

increasedblocksizesummaryThat’s almost a 2.5 time increase in performance just by changing the block size for TFTP! Depending on your MTU you may be able to increase this even further, above the 1200 bytes I chose for this example.

Wrapup

Hope this was helpful in not only seeing how you can increase the speed of your transfers with TFTP, but also to see how to troubleshoot what causes issues like this and use tools like Wireshark to get to the bottom of it.  One thing to note, TFTP is often the go to default for transferring files to routers and switches but depending on your use case there may be other options that are better.  If you are using an unreliable link you may be better off going with the TCP based FTP option, or if you need to securely transfer something SCP is a solid bet.  It all depends on what your requirements are.

Easily Parse Netdr output

When processing traffic on a 6500, we generally like to see everything done in hardware. The CPU(really two CPU’s, one for Routing and one for Switching) is usually not involved with the traffic forwarding decision, and only really comes into the picture for a select few types of traffic.  Some of these include:

  • Control traffic (STP,CDP,VTP,HSRP, and similar protocols)
  • Routing Updates
  • Traffic destined to the switch (SSH,Telnet, SNMP)
  • ACL entries with ‘log’ on the end of a line
  • Fragmentation

For a full list please see this page at Cisco.

Netdr Overview

Netdr is a debug tool included with the 6500 platform that allows you to capture traffic going to/from the route processor or switch processor.  Unlike other debugs that come with huge warnings of terrible things that could happen if you run them, netdr is generally considered to be safe. You can run it on a switch that already has very high CPU without any additional negative impact.  The goal here is to see what type(s) of traffic are hitting the CPU and causing it to be so high, and then ultimately track that traffic down and stop it.  There are a number of really good articles written on Cisco’s site and other blogs on how to use netdr to troubleshoot high cpu.  Start here, and then use some Googling to fill in the missing pieces.  I don’t want to reinvent the wheel here so I’ll leave how to use the tool to some of the other sites out there.

Interpreting the results

What I really wanted to share was this tool I came across on Cisco’s site.  Once you use netdr and get the output it can be somewhat overwhelming to look at as well as tedious to sort through all of the results and get a good idea of what traffic is an issue and what traffic is normally hitting the cpu.  The typical output looks something like this:

—— dump of incoming inband packet ——-
interface Vl204, routine mistral_process_rx_packet_inlin, timestamp 15:41:28.768
dbus info: src_vlan 0xCC(204), src_indx 0x341(833), len 0x62(98)
bpdu 0, index_dir 0, flood 0, dont_lrn 0, dest_indx 0x380(896)
EE020400 00CC0400 03410000 62080000 00590418 0E000040 00000000 03800000
mistral hdr: req_token 0x0(0), src_index 0x341(833), rx_offset 0x76(118)
requeue 0, obl_pkt 0, vlan 0xCC(204)
destmac 00.14.F1.12.40.00, srcmac 00.14.F1.12.48.00, protocol 0800
protocol ip: version 0x04, hlen 0x05, tos 0xC0, totlen 80, identifier 6476
df 0, mf 0, fo 0, ttl 1, src 10.20.204.3, dst 10.20.204.2, proto 89
layer 3 data: 45C00050 194C0000 0159F31B 0A14CC03 0A14CC02 0205002C
0AFEFE02 000007D0 00000002 00000110 53B4CAAE 00072005
0A2C004F 0AFEFE04 0000FFFF 00000344 00000380 1800

You can scan the output and see that all the pieces of a typical frame and packet are in there, Things like src/dst MAC, src/dst IP, protocol, and some data in hex format that isn’t easily readable.  If you need to repeat this for a large number of packets it gets very tedious.    I found (stumbled upon) a great tool on Cisco’s site that makes this all much easier.

Netdr Parser

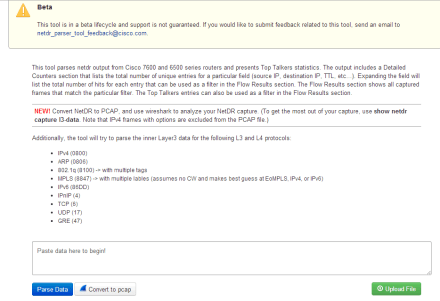
On the Cisco tools site there is a link to the NetDR Parser.   When you first get to the page it gives you the option of pasting your output into the window, or uploading a file that contains netdr output.  If you have a lot of netdr data to go through I’d recommend you redirect the output to something like a tftp server using ‘show netdr capture l3-data | redirect tftp://a.b.c.d/netdroutput.txt’.  That way you don’t need to worry about logging your ssh session or copy/pasting.

netdrstart

Once you get your NetDR output into the tool you click the ‘Parse Data’ button and the tool goes to work. The results page gives you a Top Talkers section similar to Netflow, with the top L2 and L3 talkers. It also has a detailed table where you can expand any of the rows by clicking on them.netdrexpanded2

This sample above was based on some netdr output I found on another site, it only contains two packets.  If you want to see this in an even more familiar format you can click the ‘Convert to PCap’ button which will export a .pcap file for you to open in wireshark for further review.

netdrpcapNow you can use any of the standard tools built into Wireshark to analyze the captured data. I think its great Cisco came up with this tool to help parse the netdr output.  Gives the customer more power to initially troubleshoot without needing to jump immediately to TAC for support.

Emulating WAN Throughput

When coming up with designs for different networks, I’ve found that more often than not the people from ‘the business’ or the people writing the applications put little or no thought into how their software may operate over a network.  The requirements either never get fully developed during the design phase of the project, sometimes because the application owners aren’t really sure what bandwidth or latency requirements their product needs, or it just gets left out completely.  If it works in production, it will definitely work in test right?  Sometimes it comes as an afterthought, usually when the project is already complete and in the form of ‘the network is slow and my application is perfect’. In an effort to try and get ahead of these typical scenarios there are a few options that allow you to give the application and business owners a better idea of how they can expect their product to perform *before* it is put into production and relied upon.  You can use these tools to test out anything from data file transfers to database queries to voice/video applications.


Apples to Apples

The first thing we want to do is to make sure we have as much of an apples to apples comparison as possible.  A good example of what usually happens is the application(maybe a database query for example) gets developed in a 1Gbps lab LAN environment, but when deployed gets put over your DS3 or 100Mbps WAN link between a corporate site and datacenter.  You’ve instantly changed the bandwidth(1Gbps to 10oMbps) and the latency (maybe something around 1ms in the LAN and 30ms over the WAN).  These are going to produce drastically different results, and while it shouldn’t really come as a surprise(you did change multiple variables here, right?), it often does.  It’s always better to avoid these headaches in advance if possible.  Regardless of the WAN emulation tool you end up using, the end goal should be your testing environment as close as possible to how it will be used in the real world, things like bandwidth, latency, and packet loss will all play a role.

The Tools

Depending on what OS you are running and what type of environment you have available to you, you have some options. I’ll run through some of the common ones I’ve used, and the more popular ones out there, but this is by no means an extensive list.  The ones that I am going to run through are all free, but there are a number of paid versions out there as well.

For the PC

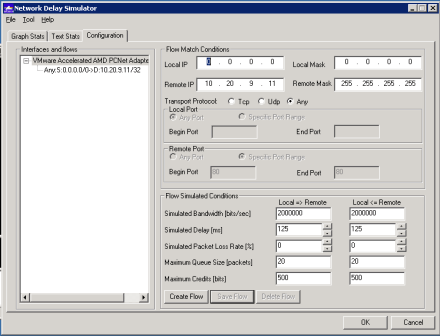
Akmalabs makes a program called Network Simulator that runs on Windows. Once installed you define flows of traffic you want to apply the WAN emulation to, and then specify parameters like bandwidth,latency,packet loss,etc.  Any traffic that doesn’t match one of your defined flows will be unaffected by the WAN emulation. In the screenshot below I defined a flow where the source was any IP, and my destination was a computer in the same subnet as the test machine.  For the sake of the example, let’s assume you were opening up a new location somewhere in Asia that would have a 2Mbps circuit, and you knew that the latency was about 250ms round trip.  Before launching the site you wanted to test some application on your local network to see how it would perform once it is in Asia.  I set the remote IP and host mask, set a speed of 2Mbps, and 125ms delay in each direction, then clicked Save.

Akma

This next screenshot shows me pinging from the test machine(Running Network Simulator) to the test IP 10.20.9.11.  You can notice that in the beginning of the ping the response times are <1 ms since it is on a 1Gb network.  Once I clicked the ‘Save Flow’ button on the Network Simulator the RTT jump to around 250ms.

Akma pings


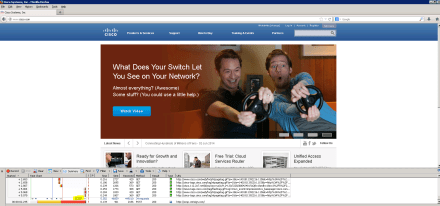
Here’s one more example. In this example I’ll test going to Cisco.com in a browser without any WAN emulation applied, and then I will apply some WAN emulation that makes the connection speed 128Kbps. In both examples I’m using HTTPWatch to test how long it takes to completely load the page.  In this screenshot you see the normal load time is 5.352 seconds.

Cisco-normal


I then start up Network Simulator and set the appropriate settings.

Akma-Cisco128K

And here is the HTTPWatch noticeably slower time for loading Cisco.com after the WAN emulation is applied:

Cisco-128K


For Linux/VMs

If you don’t want to install software to your computer, one of the more popular free WAN Emulators is the open source WANEM.  It is well documented and there are a number of other blog articles written on it’s different features.  WANEM comes in the form of a bootable ISO based on Linux that you could startup in any spare laptop you have lying around. If you don’t have a separate computer to dedicate to this you could also install VirtualBox and load up either the bootable ISO or if you have VMWare you could grab the Virtual Appliance they offer. Once it’s up and running there is a web GUI you can access to set all of the parameters.  In this example I had VirtualBox running the bootable ISO on my machine in ‘bridged mode’ networking so it grabbed a real address via DHCP on my network.  There are multiple ways you can send traffic to WANEM, all of which are covered in the documentation so I won’t go into much detail.  In this example I defined a route on my Windows machine sending all traffic for a test IP address to the WANEM IP address.  Alternatively you could define a route on your machine to send ALL traffic to WANEM. It all depends on what you are testing.  When adding the routes in Windows you need admin rights(‘Run as Administrator’ for a cmd prompt). For my example I added a route for a specific host like this, where 4.2.2.2 is the destination address and 10.20.239.28 is the IP address of the WANEM software in my VirtualBox:

wanem-routeadd


Once WANEM is running you can browse to it in a web browser and start set the parameters.  One cool thing you can do is use their ‘WANalyzer’ which will let you enter in a test IP address and evaluate the network between WANEM and the test IP to determine stuff like the speed, delay, and jitter. You then can apply these settings directly to any of the traffic you are testing in the emulator.  This is good if you aren’t sure about what your network conditions are like and can be a good place to start. I would use this with caution and check the results to see if they are what you would expect. If you know all of the settings already, then you can skip this part.  This is what the results look like for the WANalyzer to a test IP:

wanem-Wanalyzer


I ended up ignoring the settings from WANalzyer and just ended up setting my own, defining a delay of 100ms:

wanem-settings


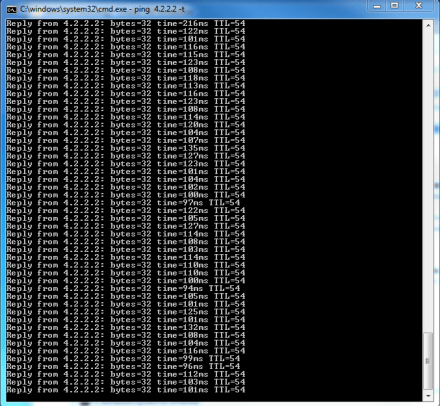
Performing a ping to the test IP 4.2.2.2 shows RTT around 100ms:

wanem-100msping

When you are done testing, make sure you delete any routes you added to your test machines.  If you don’t you’ll just end up pulling your hair out later on when you are getting poor performance or something isn’t working correctly:

wanem-routedelete

For the MAC

If you are on a MAC and don’t feel like installing anything, good news, you have a WAN emulation software already built in.  This takes advantage of the built-in ‘ipfw’ app.  There are two parts to setting this up, the first involves creating pipes that define the source and destination of the traffic you want to send through the WAN emulator, and the second involves configuring the pipes for things like bandwidth, latency, and packet loss.

Here’s the first part, I’ll define the traffic I want to send through the WAN emulation  In this case I’ll pick traffic going to Google’s public DNS 8.8.8.8:


sudo ipfw add pipe 1 ip from any to 8.8.8.8

sudo ipfw add pipe 1 ip from 8.8.8.8 to any


Next I’ll add in the delay for that pipe.  In this case, we will add in 75ms delay.  Besides delay you can also set the speed and packet loss. The syntax is:

sudo ipfw pipe 1 config delay [delay] bw [bandwidth] plr [packetloss_as_decimal]


For mine i used:

sudo ipfw pipe 1 config delay 75ms

sudo ipfw pipe 2 config delay 75ms

And here is the output of a ping:

-iMac:~ Joe$ ping 8.8.8.8

PING 8.8.8.8 (8.8.8.8): 56 data bytes

64 bytes from 8.8.8.8: icmp_seq=0 ttl=45 time=176.715 ms

64 bytes from 8.8.8.8: icmp_seq=1 ttl=45 time=176.334 ms

64 bytes from 8.8.8.8: icmp_seq=2 ttl=45 time=175.636 ms

64 bytes from 8.8.8.8: icmp_seq=3 ttl=45 time=187.775 ms


This is ~175ms, 75ms in each direction, plus around 25ms of normal RTT without the ipfw rules.


When you are done testing, make sure to delete the rules or flush them out:

sudo ipfw -q flush


Wrap Up

So that’s it, I’d encourage you to play with some or all of these tools and get familiar with them.  Whether you just want to learn how different network conditions can impact applications or you have a real project you want to test out, they are very useful.  There are some limitations as to the conditions you can test with each of the tools, so read through some of the documentation first to make sure they will yield accurate results for your test scenarios.  If you are looking to test something beyond what the free versions can offer you can look to some of the paid versions of software that are out there.  Hope this was helpful.

Automation: Making Better networks

As part of the same project I wrote this python script for, I created an Excel/VBA script to allow our team to quickly and consistently input all of the data required for the VPN hardware we were shipping out to over 450 locations.  The output of this Excel spreadsheet would later serve as the input to the Python script I wrote, and combined they are working out very well.

Why Bother?

Before I dive into the Excel/VBA code I’d like to give a little bit of background on my thoughts on why this was worth getting into.  From my experience, it’s fairly easy to come up with the configuration for a single site, or even a couple of sites.  You have the time to verify everything is correct, put everything in by hand, and really dedicate the time to check everything is how you want it.  This gets more difficult as you scale in size.  Even at 10 or 20 sites you start to increase your margin of error for a typo here or there, or you might run out of time and not be able to check everything as well as you would like.  Once you start to get into hundreds of devices to configure it makes things that much more complex.  It’s now very difficult, if not impossible, for a single person to manually configure each location and requires a very large amount of time dedicated to a single project.  If you take the time to automate a process, whether it is with a script, Excel, or some other combination of tools you can reduce the number of human errors as well as reduce the time and resources that would otherwise need to be dedicated to the project.

The problem

The project that led to this particular Excel VBA script required shipping out VPN hardware to over 450 locations.  Each VPN appliance was shipped to us by the carrier and was already assigned to a specific site.  There were a few different unique pieces of information, all in different spreadsheets that all needed to be tied together:

  1. Spreadsheet including Site ID and MAC address of VPN appliance
  2. Spreadsheet including Public IP address information from various broadband providers
  3. Spreadsheet including Internal IP addresses and identifying the type of configuration each site would get

The different types of configurations for each site were important as they dictated what equipment and information would need to be set up for each site.  The three options were:

  1. Broadband as a primary connection with a cellular USB as the backup
  2. Combination of broadband and T1
  3. T1 with cellular backup

If you had a site that fell under ‘option 1’ then it required entering in the public IP address information for that site, as well as keeping track of the cellular SIM ICCID and IMEI numbers.  If you had a site that was under ‘option 2’ you would only enter in the public broadband IP address, but would not need to package any cellular USB sticks.  If you had a site with ‘option 3’ then you would not have any broadband IP information to enter, but would need to package a cellular USB stick and record that information down.

Doing any of the above manually would be very labor intensive, flipping between multiple spreadsheets to check the type of setup the site would have, figure out which information to record and ship out. So, we automate.

VBA

Prior to this project I hadn’t written a VBA script since middle school.  I ended up having to re-learn a number of things to write this script but in the end it was worth it.  It has a lot of similarity to a pivot table, with some added extras.  The idea behind the script is this:

  • Every VPN hardware appliance has a barcode on the box that includes the MAC address of the device.  We can use a barcode scanner to scan that box and do a lookup of the MAC address in Spreadsheet #1 which will give us the site ID we are working with.
  • Then do another lookup of that site ID in another spreadsheet and pull the type of configuration(Broadband,Cellular,T1 combinations)
  • Prompt the user for the appropriate required information, depending on which type of configuration the site will get.  For example, if the site will need Broadband and cellular, then display the fields for broadband IP address and cellular information.  If the site will be getting a T1 with cell backup, don’t prompt the user for any broadband information.
  • At the end of the script, tell the user which instructions to package with the device before it gets shipped out.

Some screenshots

Here’s some screenshots of what the tool looks like when run with a Broadband/Cell Site:

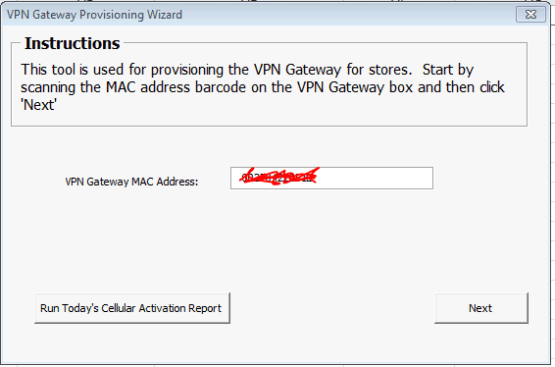
1) Start off by scanning the barcode of the VPN Appliance

Image

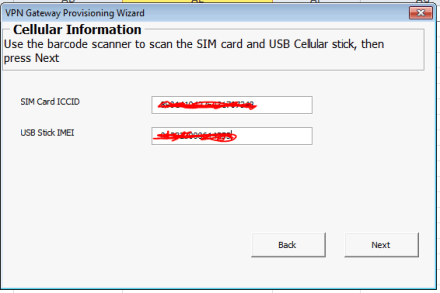
2)Prompt the user for the appropriate information so it can be saved to a database.

Detected this was a broadband/cellular site. Prompt the user for the appropriate information.

Detected this was a broadband/cellular site. Prompt the user for the appropriate information.

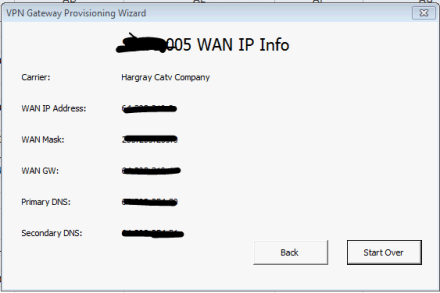
3)Present the user with all of the necessary information for that store so they can enter it into the VPN gateway.

Present the Broadband IP address information to the user for this specific site so they can enter it into the VPN hardware appliance.

Present the Broadband IP address information to the user for this specific site so they can enter it into the VPN hardware appliance.