So many pings…

When I got into networking there was only one type of ping I was familiar with: ping.  After being in networking for awhile and working with different groups I’ve come to encounter a few other varieties of ping-like tools that are used to perform basic troubleshooting for different applications.  Here’s a high level look at some of the more popular ones I have encountered.

Ping

Ping is probably the most common and well known tool for troubleshooting reachability of a host.  Ping usually uses ICMP (although it can be set to use UDP or TCP on operating system). It sends an echo packet to the destination and waits for the echo-reply packet to be sent back.  With it’s default settings ping is able to show you if a host is active, the round trip time, TTL, and any packet loss.  Using other options you can also use it to troubleshoot fragmentation issues, MTU issues, or determine the return path (record option).  Ping comes standard on every operating system as well as all networking hardware. For more info on the version of ping included in Cisco IOS check out this page.

TNSPing

TNSPing is a utility created by Oracle to determine if an Oracle service can be successfully reached over the network. It only confirms if the listener is up and will not give you any indication of the state of the database itself.

TNSPing will test a few things:

  • Was the service name specified correctly – typically it is defined in the tnsnames.ora file
  • Is the listener listening (if it can’t connect to the listener you can doublecheck the correct port was specified in the tnsnames.ora file and that any firewall between the tnsping utility and destination is allowing the traffic)
  • The roundtrip time for each connection test

For more information on TNSPing check out this link from Oracle.

NIPing

NiPing is a tool developed by SAP.  Niping will test:

  • to test network connectivity
  • latency
  • throughput.

Niping works similarly to a iperf/ttcp test in that it requires a client and server version of the tool to run.  Like TNSPing, Niping runs tests on a higher level than ICMP does.  Niping is useful to see if the required ports for SAP are open on a firewall if telnet isn’t available.  For more information on NiPing check out this link.

Advertisement

Managing Packet Captures

Packet captures are an important part of the network engineers toolkit.  They provide a look into what is really going on in your network and help get to the bottom of troubleshooting an issue very quickly.  In addition to getting to the bottom of a problem, they also serve as a great learning tool to get a better understanding of how different protocols work, and more importantly how they work in your network.  A company called QA cafe has a really great product called Cloudshark, that allows you to manage and analyze your packet captures without installing any software like Wireshark locally. Everything is handled in the web browser.  I wanted to write a quick post to take a look at the available options from Cloudshark and how they might work best for you.

Overview

Cloudshark was intended to be used as a hardware or VM appliance within a company.  Employees could then upload packet captures to the appliance for storage and analysis.  They currently offer a Solo, Professional, and Enterprise version, with the biggest difference being the number of accounts you can create on each and an ability to integrate with Active Directory for the enterprise version.  I recently setup the enterprise VM appliance and it was extremely quick to get going, requiring barely any input from me.  If you aren’t sure if you want to commit to spending money on the product and want to try it out, or need to send someone a packet capture (that doesn’t contain sensitive information) for further review, they do have a page that allows you to upload up to 10MB of a capture, and then will generate a URL you can send off to someone else.  I encourage you to check it out here:https://appliance.cloudshark.org/upload/

Features

Cloudshark really worked to get as many features from Wireshark into the web based product, to the point that sometimes you forget that you are working in a web browser.  When you first login to the product you are presented with a page that has a list of your currently uploaded files, as well as a place to upload new files, or search for a saved capture. The interface is clean, and easy to find what you’re looking for.


Increase Cisco TFTP speed

I was recently copying a fairly large 400 MB IOS image to one of our ASR routers and it was taking forever via TFTP.  I had seen this before but never really took any time to look into it further. I always switched to FTP, the transfer went faster, and I never looked back.  This time I decided to go to Wireshark and take a deeper look. In this post I’ll show you why it’s slow and how to improve the speed, but perhaps more importantly, how to get to the bottom of something like this using Wireshark. 

Default TFTP Setting

I performed a packet capture on a TFTP session using the default Cisco router and TFTP server settings.  It immediately became clear what the issue was.  Here is a screenshot as well as a link to part of the capture file on Cloudshark.

tftpdefaultscreencap

The length of each of the frame is ~500 bytes.  This was being transferred over Ethernet, which has a max frame size of 1518 bytes.  This means we weren’t fully taking advantage of our available frame size.  It’d be the equivalent if I told you to empty a swimming pool and you had the option to use a small plastic cup or a 5 gallon bucket for each trip you took to the pool.  The 5 gallon bucket would require far less trips back and forth and decrease the total time needed to empty the pool.

According to the RFC for TFTP, TFTP will transfer data in blocks of 512 bytes at a time, which is what we were seeing with our default settings.

Make it faster

So how do we make this go faster? Well, besides using one of the other TCP based alternatives like SCP or FTP, there is an option in IOS available to increase the TFTP blocksize.  In my case I am using an ASR router and the option was there. I didn’t look into seeing which other platforms/ IOS versions this is supported in. 

The command you are interested in is: ip tftp blocksize <blocksize> In my case I chose to set the blocksize to 1200 bytes because I have the Cisco VPN client installed which changes your MTU size to 1300 bytes and I didn’t want to deal with fragmentation.  Here’s a screenshot of the transfer with the updated block size and link to capture on Cloudshark.org.

tftpincreasedblocksize

Confirming the increase

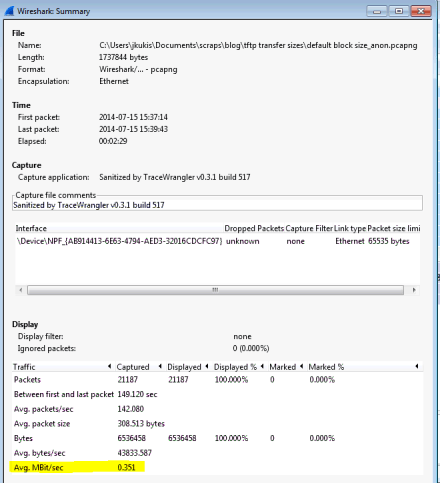
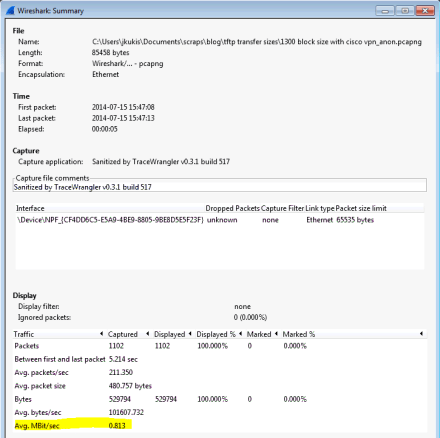
Besides seeing the bigger blocksize in the capture and noticing the speed was faster, let’s back it up with some real data.  If you click the Statistics – Summary menu you can see an average rate for each capture.

Here’s the ‘before’ rate with the default block size:

defaultblocksizesummary

And here is the summary using the increased block size of 1200 bytes:

increasedblocksizesummaryThat’s almost a 2.5 time increase in performance just by changing the block size for TFTP! Depending on your MTU you may be able to increase this even further, above the 1200 bytes I chose for this example.

Wrapup

Hope this was helpful in not only seeing how you can increase the speed of your transfers with TFTP, but also to see how to troubleshoot what causes issues like this and use tools like Wireshark to get to the bottom of it.  One thing to note, TFTP is often the go to default for transferring files to routers and switches but depending on your use case there may be other options that are better.  If you are using an unreliable link you may be better off going with the TCP based FTP option, or if you need to securely transfer something SCP is a solid bet.  It all depends on what your requirements are.