I recently ran into an issue that was new to me, but after some further research proved to be fairly well known phenomenon that can be difficult to track down. We had a Cisco linecard with some servers connected to it that were generating a fairly large number of output drops on an interface, while at the same time having a low average traffic utilization. Enter the microburst.
Microbursts are patterns or spikes of traffic that take place in a relatively short time interval(generally sub-second) causing network interfaces to temporarily become oversubscribed and drop traffic. While bursty traffic is fairly common in networks and in most cases is handled by buffers, in some cases the spike in traffic is more than the buffer and interface can handle. In general, traffic will be more bursty on edge and aggregation links than on core links.
Admitting you have a problem
One of the biggest challenges of microbursts is that you may not even know they are occurring. Typical monitoring systems(Solarwinds,Cacti,etc) pull interface traffic statistics every one or five minutes by default. In most cases this gives you a good view into what is going on in your network on the interface level for any traffic patterns that are relatively consistent. Unfortunately this doesn’t allow you to see bursty traffic that occurs in any short time interval less than the one you are graphing.
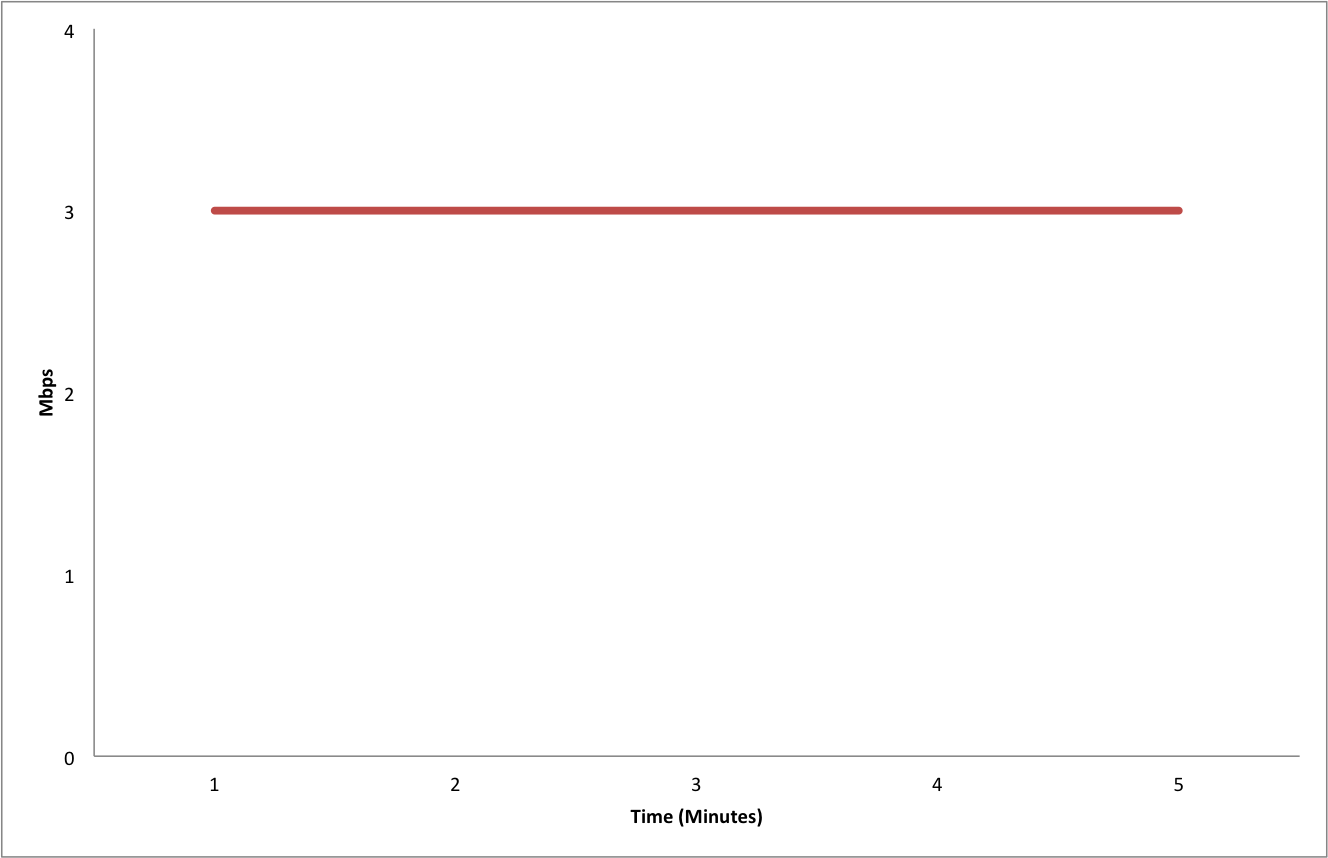
Since it isn’t practical to change your monitoring systems to poll interfaces every second, the first place you might notice you are experiencing bursty traffic is in the interface statistics on your switch under “Total Output Drops”. In the output below, we are seeing output drops even though the 5 minute output rate is ~2.9Mbps (much less than the 10Mbps the interface supports).
Switch#sh int fa0/1 | include duplex|output drops|rateFull-duplex, 10Mb/s, media type is 10/100BaseTXInput queue: 0/75/0/0 (size/max/drops/flushes); Total output drops: 72285 minute input rate 0 bits/sec, 0 packets/sec5 minute output rate 2921000 bits/sec, 477 packets/sec
Output drops are caused by congested interfaces. If you are consistently seeing output drops increment in combination with reaching the line speed of the interface your best option is to look into increasing the speed of that link. In this case you would most likely see this high traffic utilization on a graph. If you are seeing output drops increment, but the overall traffic utilization of that interface is otherwise low, you are most likely experiencing some type of bursty traffic. One quick change you can make to the interface is to shorten the load interval from the default 5 minutes to 30 seconds using the interface-level command ‘load-interval 30’. This will change the statistics shown in the output above to report over a 30 second interval instead of 5 minutes and may make the bursty traffic easier to see. There’s a chance that even 30 seconds may be too long, and if that is the case we can use the Wireshark to look for these bursts.
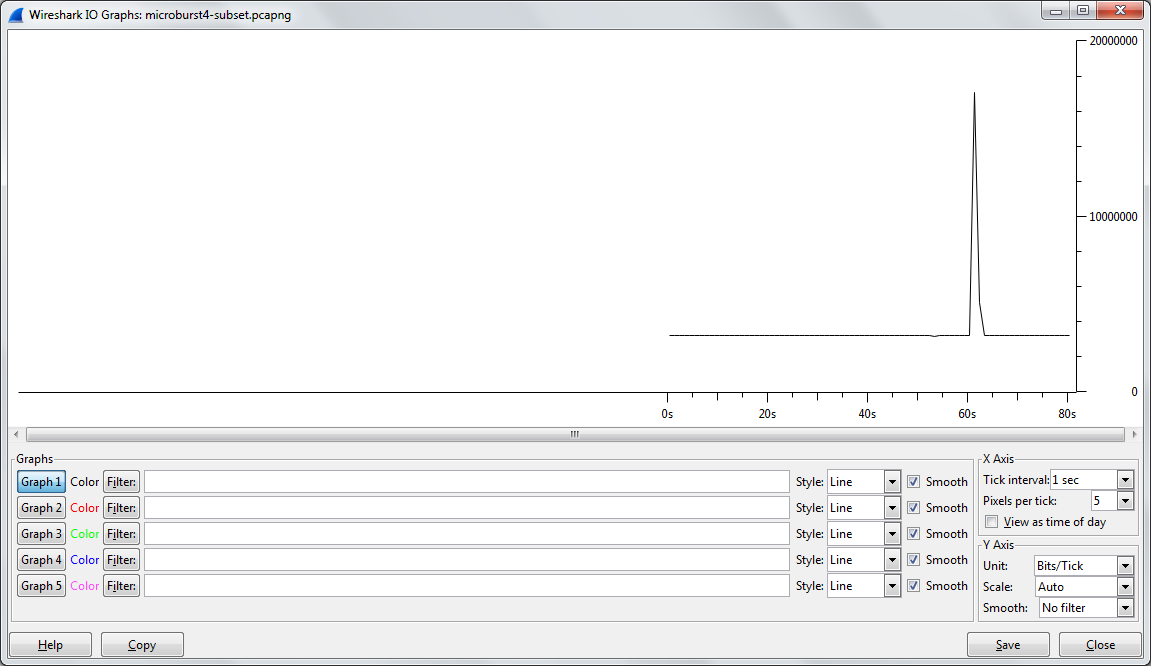
Using Wireshark to identify the bursty traffic

Wireshark IOGraph
Conclusion
Identifying microbursts or any bursty traffic is a good example of why it’s important to ‘know what you don’t know’. If someone complains about seeing issues on a link it’s important not to immediately dismiss the complaint and do some due diligence. While monitoring interface statistics via SNMP in 1 or 5 minute intervals is an excellent start, it’s important to know that there may be things going on in the network that aren’t showing up in those graphs. By utilizing a number of different tools you can trace down problems. Reducing the interface load-interval to 30 seconds and tracking your output drops is a good start.Using Wireshark allows you to dive further into the problem and figure out what traffic is causing or contributing to the drops.

Fantastic goods from you, man. I’ve understand your stuff previous to and you’re just too magnificent.
I really like what you have acquired here, really like what you are saying and the way in which
you say it. You make it enjoyable and you still take care of to keep it sensible.
I can not wait to read far more from you. This is actually
a tremendous site.
Pingback: Troubleshooting with Wireshark IO Graphs : Part 1 | not (always) the network
The best monitor tool to detect microburst would be Splunk.
Thank you very much! This is very very useful for me in our case. However, it is much more trickier than we thought it is. Are there any other ways you know to monitor the microburst please?
Hello,
Very good article, what type of traffic is this one?